3 minutes
React.js Problem Solving Notes
This series of posts summaries the problems/issues I met during work, and the solutions of how I solved these problems.
-
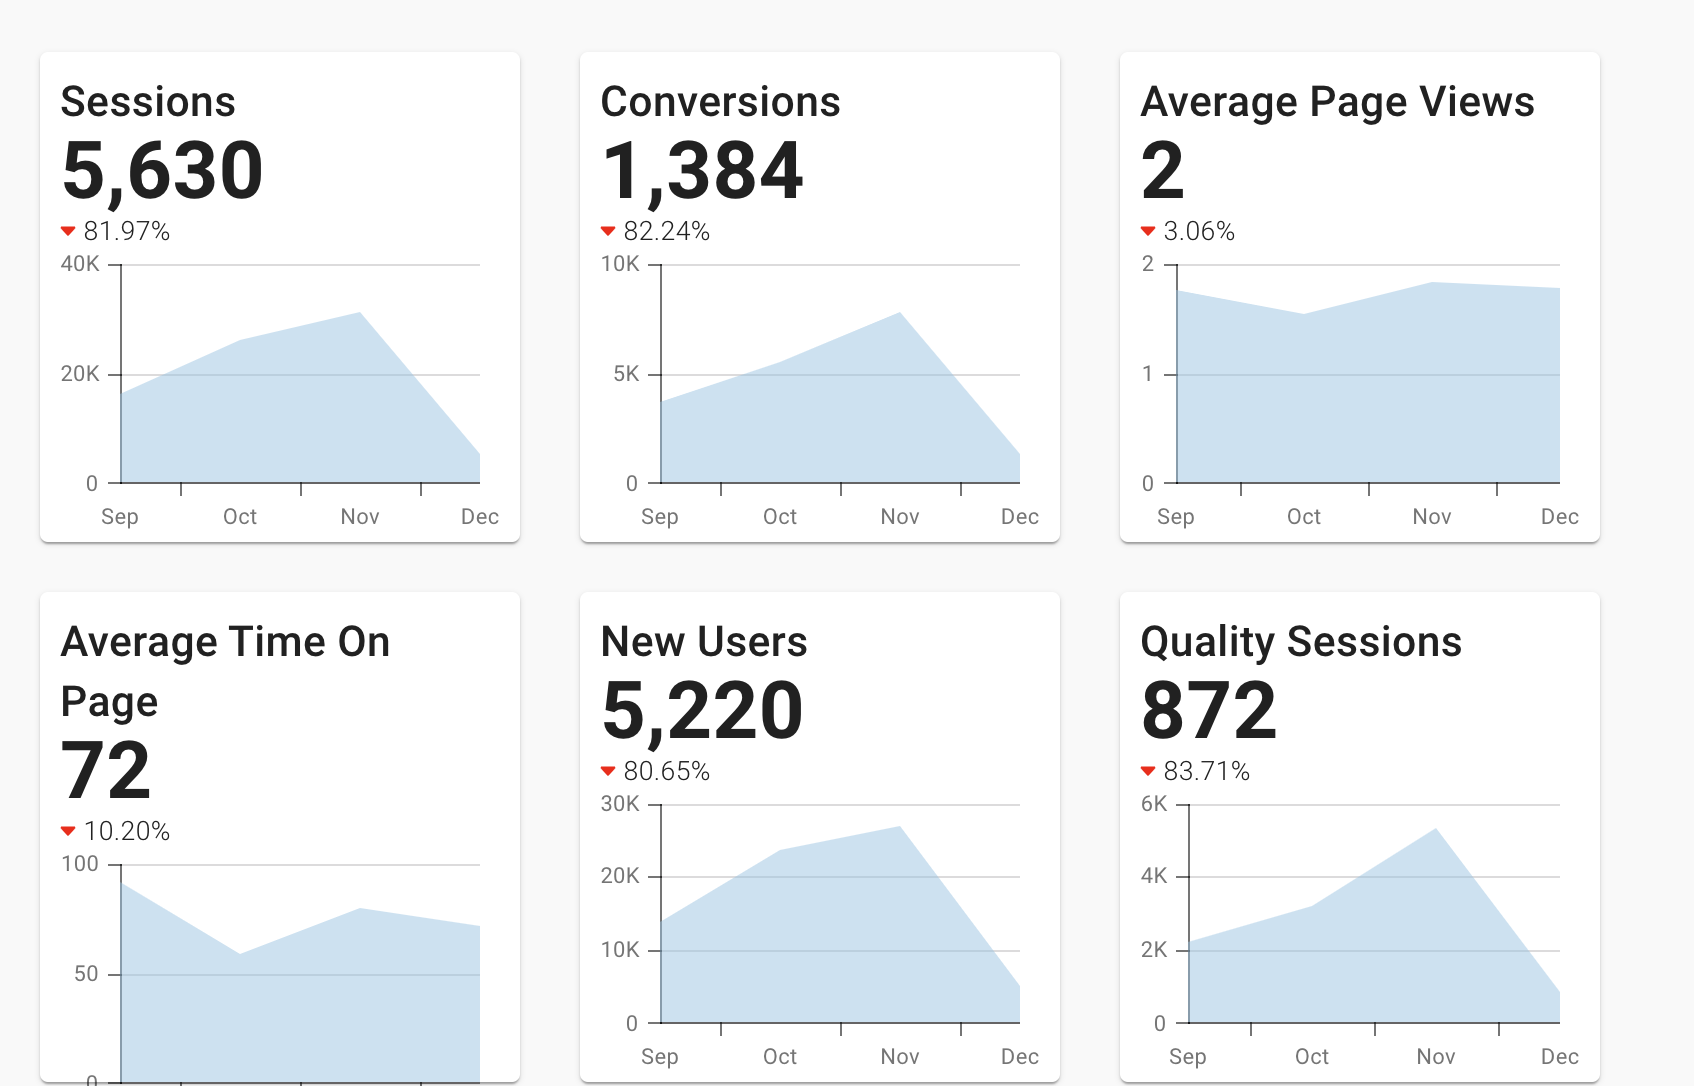
How do I parse a
.jsondata file to pass into this DevExtreme component and render out a series of area charts?Data looks like:
type Data = {
  period_index: number,
  breakdown: {
    sessions: number,
    conversions: number,
    avg_page_views: number,
    avg_time_on_page: number,
    new_users: number,
  }
}[]
parseData = (data: Data | any) => { if (data.length > 0) { const sampleData = data[0]; const keys = Object.keys(sampleData.breakdown); const resultWithMonth = data.map((d: { period_index: number; month: number; date: string; }) => { const month = (d.period_index % 12) + 1 const date = moment(`${month}`, "M").format('MMM') d.month = month d.date = date return d }) const result = keys.map(key => { const dataSource = resultWithMonth.map((d: { period_index: any; breakdown: { [x: string]: any; }; date: any; }) => { return { period_index: d.period_index, [key]: d.breakdown[key], monthString: d.date } }) return { title: key, subtitle: numeral(dataSource[dataSource.length - 1][key]).format('0,0'), dataSource } }) return result } return [] } parseMonthData = (period: string) => { const month = (parseInt(period) % 12) + 1 const year = 1900 + (parseInt(period) - (parseInt(period) % 12)) / 12 const date = moment(`${month}`, "M").format('MMMM') return date }Chart looks like:
-
How to parse data and get color ranges so that the colors in the table are dynamically changed based on the value in the cell?
const COLUMNS = ['value', 'count', 'Clicks', 'Conversions', 'Cost', 'avg_cpm', 'avg_cpc', 'avg_cpa']
const COLOR = '#1c558e'


const getColorRanges = (data: DataType[] | any): number[][] => {
  const colorRanges = COLUMNS.map(col => {
    if (col === 'value') return [] //keywords, do nothing.

    const sorted = data
      .map((x: DataType) => x[col])
      .sort((a: number, b: number) => a - b);

    return [sorted[0], sorted[sorted.length - 1]];
  })

  return colorRanges
}

const colorRanges = getColorRanges(data);

const getBackgroundColor = (column: string, value: number) => {
  const columnIndex = COLUMNS.indexOf(column);
  const colorRange = colorRanges[columnIndex];
  const [min, max] = colorRange;
  const colorWeight = (value - min) / (max - min);
  const color = COLOR + Math.ceil(128 + colorWeight * 127).toString(16);
  const opacity = (128 + colorWeight * 127) / 255
  return [color, opacity];
}
// inside the devExpress data Grid component, there's a config is called `cellRender`, where you can adjust the style and/or render config for cells.
cellRender={cell => {
  const columnWithDollar = ['Cost', 'CPC', 'CPM', 'CPA']
  const { caption } = cell.column
  if (col !== 'value') {
 		 const [backgroundColor, opacity] = getBackgroundColor(col, cell.data[col]);
  		cell.cellElement.style.backgroundColor = backgroundColor
  		if (opacity > 0.9) {
  		  cell.cellElement.style.color = '#ddd'
  }
  return (columnWithDollar.includes(caption) ? 		(numeral(cell.data[col]).format('$0,0.00')) : (numeral(cell.data[col]).format('0,0')));
  }
  else return cell.data[col]
  }}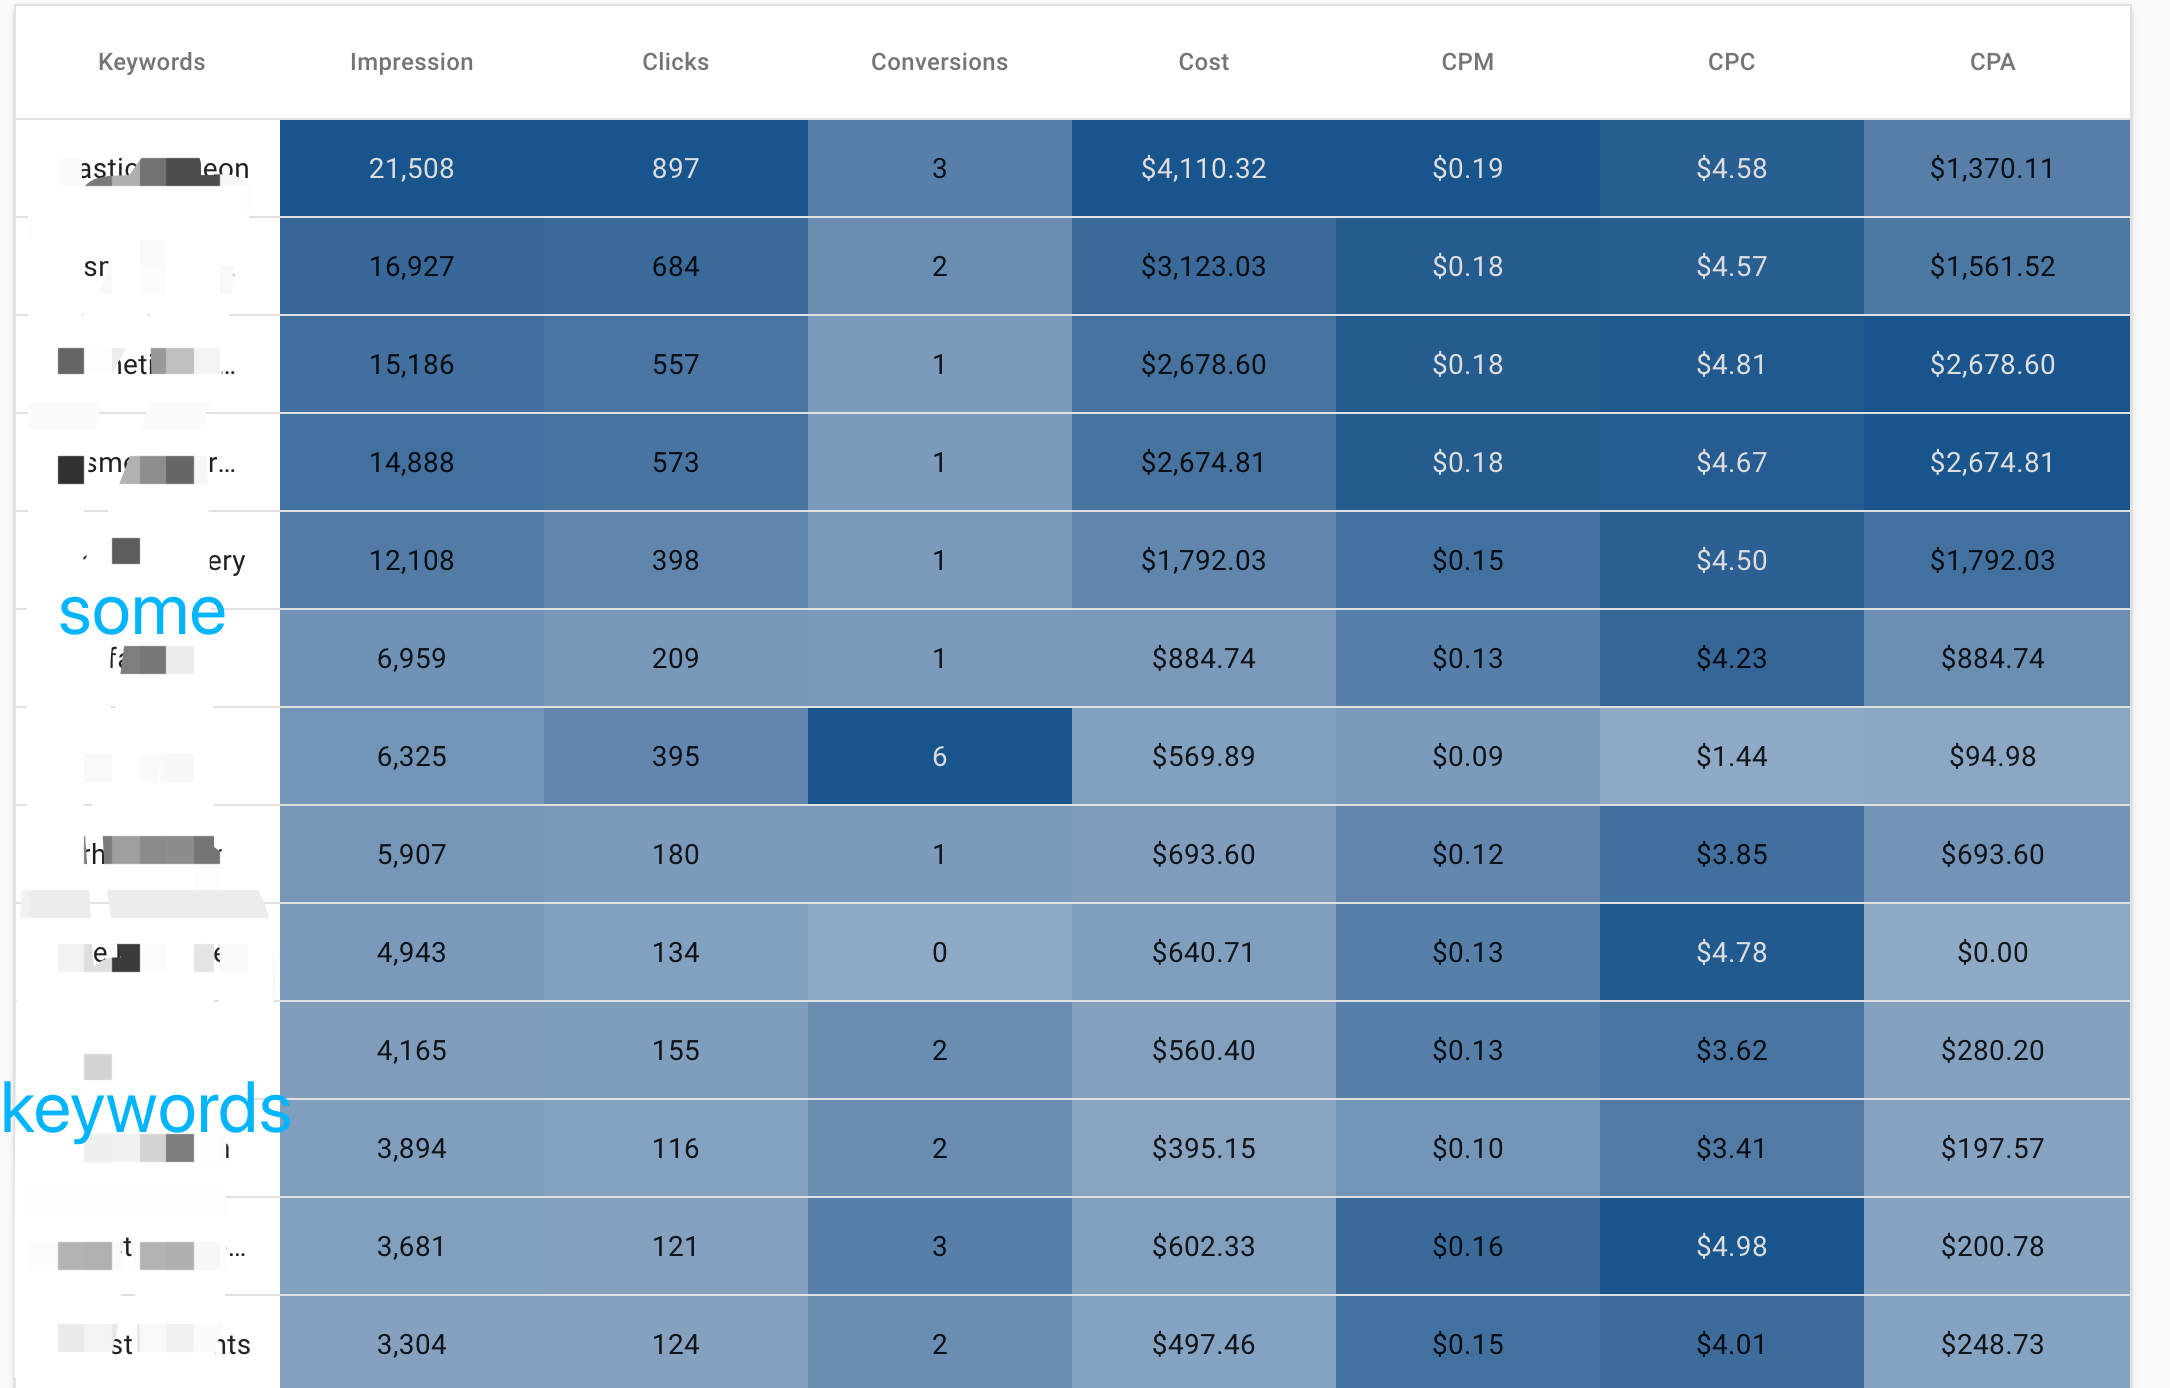
comments powered by Disqus